
Ofcom have released the latest UK internet use statistics, known as Online Nation.
Every year, Ofcom publish UK internet use statistics in the form of their Online Nation report. It never fails to captivate me. However, it also serves as a valuable reminder that surveys of this nature always reveal surprises.
My clients are aware that I advise them to be driven by data, allowing for a degree of business related intervention. Too many businesses attempt to target their audience based on personal opinion within their organisation.
The Ofcom report contains extremely important pointers as to where, what and why people do what they do online. It becomes important in respect of SEO and CRO because it provides an insight you can’t obtain anywhere else.
It collates information in such a way that it puts a different perspective on internet usage trends in the UK . The fact that it does so by age group and gender is incredibly useful.
Is it a human trait that we’re all somewhat guilty of thinking that others will behave in the same way we do? Working in SEO means I’m exposed to data on a daily basis that tells me we don’t. The 2024 Ofcom report solidifies that view.
Time spent online by UK adults
I wasn’t surprised to see an average time spent online of 4 hours 20 minutes. If you take working lives into account, I don’t think that is higher than I might have anticipated.
However, despite the global dominance of the mobile phone, I was surprised to see almost 75% of that time (across all 18+ age groups) is spent on smartphones.
It is a reminder to anyone working in SEO, and businesses intent on pursuing higher Google rankings, that ensuring your site is mobile responsive is essential. You should already know it, and the fact that Google indexes on a ‘mobile priority’ basis – meaning that how it views the mobile version of your website is how it’ll rank it in search results.

There are a few things to bear in mind when reading the above graph. It is all types of internet activity. Smartphone activities such as banking, gaming and dating apps are all taken into account.
The highest use age group is probably to be expected. The 18-24 year olds spend a huge 6 hours and 1 minute online.
The 65+ age group, mobiles and tablets
There are some other interesting facts in the split of devices used. For example, the 65+ age group spending twice the amount of time (as a percentage of their overall online time) using tablets (e.g. iPad) than the 18-24 year old group. When you consider lifestyles, it isn’t the surprise it might first appear. However, it is another reminder to ensure that your website works correctly on tablet devices.
The 65+ age group is also far more apparent in internet use than ever before. As the internet cements it’s grip on society, it shouldn’t be a shock. The rise of tablet use is also a factor, as indeed is the spread of the smartphone in older demographics.
Time online by age group and gender
The report confirms the long-known fact about female use of the internet – they spend more time online than men.
The age group in which the gap between genders is most stark is once again the 18-24 year olds. Women in this group spend approximately 18% more time online than men.

Overall, woman spend in the region of 13% more time online than men. The 45-54 year age group shows the shortest time gap between genders, with women just 9% ahead of men.
It is only when you compare the 18-24 year old age group to what might be considered their parents age group that you see the true level of lifestyle reliance on the internet. The younger age group spends twice the amount of time online than their parents age group. There’ll be little shock amongst parents reading this.
Time online by UK home nations
I’ll be the first to admit that this one surprised me. Because of the way the UK is comprised, we get a comparison of the home nations.
Scotland and Wales average 28 minutes more time online each day than England, even though the percentage split of that time across devices is nigh on identical.
England and Northern Ireland spend the same amount of time online per day. However, there is an intriguing difference in their use of desktop and tablet devices. English users spend almost 50% more time using desktop computers than those in Northern Ireland. The bulk of that gap is made by the Northern Irish users spending almost 27% more time using tablet devices.

The report offered no explanation for the desktop versus tablet use disparity between England and Northern Ireland. I have to admit I am perplexed by it. It could be related to the cost of desktop computers and the drop in price of tablets? Unfortunately, that doesn’t correlate well to any demographic differences between the two nations.
Still, I keep getting drawn back to the Scottish and Welsh internet use. It is 7% above the UK average and, at least in the world of SEO, that is a big number.
Where do UK adults spend time online?
Year-on-year comparisons by Ofcom are fantastic when it comes to identifying trends around changing behaviour. They show precisely where UK adults spend their time online and provide an overlaid comparison.
The shift in behaviour isn’t huge, but you can see the move to a more mobile user than in 2023. There is a 1% drop in people using the internet solely at home. However, this is a 2% rise in those saying they use it at home and ‘elsewhere’.

Mobile phone accessibility to faster connection speeds is a factor. Rising home internet costs were cited by some participants as a reason for not having home broadband services.
Most visited online companies or brands
This section highlights the online dominance of a small number of internet/online brands. Ofcom looks at which online companies, at parent company level, are the most visited by the UK population.
For anyone glancing at the chart below and wondering who some of the companies are, Alphabet is the parent company of Google (and YouTube). Meta is the parent company of Facebook, Instagram, WhatsApp and Threads.
I suspect that Reach plc will be a mystery to many. They’re the parent group of some of the UK’s biggest news outlets. That includes the Daily Mirror, Express, Star etc. They also own several very large regional brands such as the Manchester Evening News.

Consider this for a moment – Alphabet brands reach 99% of the entire UK online population. That is a mind-blowingly large proportion. It is, effectively, blanket reach.
Meta, being just a few percentage points behind, demonstrates how adept they’ve been at ensuring they have a product for every age group. I recall a time when people were [incorrectly] commenting on the apparent downfall of Facebook and the rise of Instagram.
Meta promptly solved any potential issue by acquiring Instagram and migrating many of its most popular features to Facebook. These giants do not become the size they are by standing still.
I doubt there are any real surprises in the table to most readers. However, I was personally surprised to see Paypal holding on to the Top 10 position. It remains a trusted payment brand, but we’ve not gone into the age group variances yet.
Most visited online brands by age group
It is only when you begin to examine the age group differences in respect of the online brands they visited that you see significant differences.
Reddit, a hugely popular online forum/discussion board, entered the fold as a Top 10 brand among younger age groups – and it did so by rocketing in at No. 7. You should take note of that. Reddit is growing at a rapid rate and if you’re of the mindset that the younger age groups aren’t your target audience, think again.

People once said the same about Facebook – and then realised that users get older and time passes quickly. Reddit users of today might remain loyal to the platform (as many Facebook users have) long into the future when they may well become part of your target age range.
Other brands that appeared in the Top 10 for younger age groups were Bytedance (the owners of TikTok), Snap (Snapchat) and Spotify (the music streaming service).
TikTok
TikTok, I’m sure, won’t surprise you. For it to be the sixth most visited online brand and be reaching 75% of 18-24 year olds is testament to how well Bytedance understand their audience.
However, far more important is to note that it is 8th in the list for 25-34 year olds. Don’t ever be left thinking “TikTok is for kids”. TikTok is often seen as the newcomer in social media, but has now been in the UK for 6 years. Yes, it arrived on our shores in August 2018. Be careful how easily you dismiss it and its power to engage.
I would also encourage any business to consider this – TikTok reaches far beyond the younger age groups. Countless parents and older users have been drawn by the addictive flow of content and ease of posting. Just because it isn’t in the 10 most visited brands doesn’t mean it isn’t popular with older age groups.
News outlets
The 18-24 age group were responsible for another very interesting statistic. They were the only group not to have Reach plc in their Top 10. That highlights a completely different view on news resources.
They, along with every other age group in the UK, consume most of their mainstream news via the BBC. It held positions 4 or 5, reaching between 76% (at its lowest) and 87% (at its highest) of the UK population online. The BBC has had its issues in recent years and is under budgetary pressure, but be under no illusion that it is the dominant media outlet in the United Kingdom.
Top 10 Alphabet visited services in UK
One of the headline statistics comes in this part of the report. UK adult use of Google Search has fallen by 3%. That’s a big reduction in a single year for what remains the biggest search engine in the country. There are several reasons behind it.
Firstly, the way in which users find material is changing. Their use of voice search and other search engines are two. The automatic default of Bing as the search engine on Microsoft Windows devices is another.
YouTube as a portal for searched-for content is another reason behind the change. The video streaming service increased use by 3% amongst adults that use Alphabet products.

Alphabet managed to achieve growth across all its services with the exception of Google Search and the Google Calendar app. The popularity of the Google Messages app grew 5% and Google Maps continued to be popular, increasing by 4%.
Decline in use of Google Search
From an SEO and brand visibility perspective, should you be concerned by the drop in Google Search? No, not overly concerned, but it serves as a reminder that Google isn’t the only search engine available. DuckDuckGo launched a major advertising campaign and Bing has continued to strengthen its position in the UK.
Don’t ignore Bing for SEO
You should be addressing any lack of SEO in respect of Bing. Don’t ignore it and some of the features it offers businesses in respect of your profile and opportunities to be ranked where other businesses might be overlooking it.
The data in the graph above doesn’t include children, it is UK adults online. I would caution against making any fundamental changes if you’ve got a good and well executed Google Search SEO strategy. However, everything changes eventually and the rampant march of technology means that there is a new wave of methods used by end-users to find content.
YouTube and video search SEO
I’ve seen other website commentators expressing alarm at the drop in reach. I’m not going to minimise the fact that 3% got most people in the world of SEO taking notice. My caveat would be that YouTube is a major asset to Google, and can be the same asset to businesses. Unfortunately, many view the production of video content as time-consuming.
The reality is that polished and expensive video production isn’t what a lot of users want to watch. There has been a significant and continued rise in the popularity of ‘real’ and ‘instantly shot’ video content. The viewer establishes more of a connection with the content or people in it.
Many users go directly to YouTube to search for guides, advice, answers, reviews, product insights etc. It takes them away from Google Search but keeping them on an Alphabet owned service.
You shouldn’t be dismissing YouTube as a visibility opportunity, you should be embracing it. SEO for video content exists and a lot can be done to improve the performance of your YouTube content. Furthermore, Google has invested resource into the way it reads video content. They will use AI to interpret what is actually happening in the video. That will undoubtedly become a vital part of the ranking process in the future.
Reach of Facebook, Instagram and WhatsApp
When we move to looking at the reach of the main Meta owned products, Facebook (inc. Messenger), Instagram and WhatsApp, you see yet more of the big brands hold on the UK.
With 70% of UK online adults using all 3 products, Meta’s stable of services remains immensely strong. The report states that 91% of adults used Facebook or Facebook Messenger in May 2024.
WhatsApp came next, closely followed by Instagram, and both platforms have increased their reach in the last 12 months. Instagram came under severe pressure from TikTok in recent years, but the app remains firmly embedded in UK online society. Users simply opt to use both instead of choosing between them in most cases.

Threads, the Meta alternative to X (formerly Twitter), managed to reach 11% of all UK adults online. I was surprised it achieved that amount of reach. It could support the theory that X/Twitter has become a more combative platform that has seen many users leave. X/Twitter has certainly changed since Elon Musk acquired it. Unfortunately, Threads still isn’t seen as a strong platform for commercial visibility in the UK. That said, X/Twitter has suffered hugely in UK advertising appeal).
Facebook has always been smart on the acquisition trail. Their addition of Instagram in 2012 was key strategic decision. The later purchase of WhatsApp raised eyebrows, but it has proved to be a few wise move. It has become the go-to messaging app in the UK and globally. The expansion of WhatsApp to include WhatsApp Business has ingrained the app in far more than domestic messaging. It is now widely used as a customer service platform by brands.
Brand share of UK online time
This chart brings the might of Alphabet and Meta into sharp focus. Their services account for almost half of all UK time spent online.
However, it shows just how much time is spent on TikTok, as Bytedance are the next closest brand to the two giants.

Snapchat (Snap owned) continues to be popular in younger age groups. It shares the same 7 minutes of our online time as Microsoft owned services.
I’ve often been asked about the commercial visibility potential of Snapchat. Organically, brands that produce good quality content on it have garnered a useful following. It has paid-for advertising services worth exploring (albeit with somewhat limited targeting options).
Top 10 UK smartphone apps
When it comes to our use of smartphone apps, I’ve already mentioned the grip WhatsApp has on the UK. This table shows just how tight that grip is.
It also shows how ingrained Facebook remains. It faces challenges in the 18-34 age group, but they’re not insurmountable when it is another Meta owned app, Instagram, that occupies top spot (after WhatsApp) with those users.

Google Maps is clearly the No.1 navigation service. I found it interesting to read about the share of that market by other brands. Apple Maps reached 18% of users, with Waze on 10% and Citymapper at 5%. The latter surprised me, I wasn’t aware quite so many UK people relied on it.
I suspect that the 2025 report will show TikTok rising up the table, and across age groups. It occupies 10th spot for the 18-34 year old group at present, and the same position in the column for use by adult women, but it isn’t going to stop there.
If I were to wager where we might see it infiltrate other age groups, apart from the general appeal of the product, I would say that TikTok Shop is where a lot of opportunity for greater reach lies. If you’ve just read that statement and were unaware that you could sell products on TikTok, it is yet another reason why it is worth investing some of your time to find out more about the app.
Smartphone users by device and socio-economic group
The detail Ofcom go to is demonstrated in this examination of the brands of smartphone used in the UK, and the socio-economic group of their users.
I don’t think there are any earth-shattering revelations in what it shows. It supports a landscape that hasn’t changed much in recent years. If you’re wondering why that data would be of any value, it is because it is good to know when something isn’t changing. That is important on a topic that is hotly debated on social channels. Don’t know what I mean? Try suggesting that Android is better than Apple, or vice versa, and see what happens.

If you’re a brand seeking to advertise on smartphone platforms, the socio-economic split of ownership is important. Apple still holds the AB group by some distance, and remains favourite with women owners.
Android devices have an almost identical hold in the DE social-economic group. That is valuable data if you want to target that audience.
One age group screams out of the chart in respect of Apple dominance – the 16-24 year olds. With 69% owning Apple devices, it stands head and shoulders above all other bars of the graph. It is also interesting because every single age group after it shows a slide in Apple’s share. It goes down to 42% in the 65+ group.
Top 5 smartphone apps by UK adult reach
Looking at the Kings of Apps, Meta must be delighted to see this chart. Their apps occupy 4 of the top 5 places in terms of reaching adults in the UK on a daily basis.
They’ll be less pleased to see the dramatic decline of Facebook Messenger. It is offset by the reach across their other apps and, in my opinion, it was inevitable that WhatsApp would become the preferred messaging app.

Alphabet’s increased reach from Gmail shouldn’t be ignored. Growing their reach by almost 2 million users in 12 months is no mean feat. Marketing executives might want to remember that Gmail is a brand that offers paid-for advertising reach through Google Ads.
Most popular online services by sector
Generative AI makes an appearance for the first time in this summary of the most popular online services by sector. We’ll be seeing a lot more of that in years to come, but ChatGPT is the front-runner for 2024.
As mentioned earlier, the importance of YouTube is shown by it ousting Facebook/Messenger as the most popular social media service.
However, your eyes may be drawn the next two lines. Tinder, the UK’s most popular dating app, has seen a decline in the last 12 months. I’ll add further comment to that later in this article, as Ofcom honed in on the specifics of each sector.
PornHub remained top for pornographic content, retaining the position it has had for several years but without growth this year.

The BBC, having seen a dip of 5% last year, rose back to 75%. The NHS is the obvious top health and wellbeing online service.
I’ll admit to not being a big user of gaming service. Whilst I have played Candy Crush Saga, I didn’t know it was still so popular in the UK. Perhaps that says more about my lack of browsing gaming apps than it does Candy Crush Saga.
I don’t think there is anything to add about Amazon leading the retail sector.
Most popular search engines in the UK
I’ve already written about Google Search, but the list of other search engines used in the UK merits comment.
I’m very conscious that people often talk about the market share of search engines, and it is important. You only need glance at the adult reach of other search engines to see the opportunities I referenced earlier.
Bing, Microsoft’s search engine, reached 18.5 million adults in the UK. That may be down on the 21.9 million of the previous year, but it is a lot of adults that many brands or companies simply don’t target. They don’t focus on Bing, diverting all their energy to Google.
I am not about to criticise any strategy that focuses on Google. However, you can’t leave Bing out of your research or goals. That is even more the case if your target audience is in older age groups that are less likely to change from their default browser on Microsoft devices (because Bing is the default search engine on Microsoft Edge, their browser).

Bing can bring you website visitors that would never even contemplate going to Google.co.uk or changing their default browser or homepage. They’re the type of users to whom a search engine is just that – a portal for finding information. They’re not bothered which company they use for it.
SEO on lesser known search engines
I also mentioned DuckDuckGo earlier. They ran a major UK TV advertising campaign and have reached an additional 202,000 UK users, putting them almost on par with Yahoo! in the table. Their users are slightly more difficult to pin down in terms of target audience. Most have probably moved to the platform because of the search anonymity and lack of tracking, so it speaks about them in that respect.
I wouldn’t recommend changing your SEO strategy or approach unless that type of audience is your target, and even if they are you probably won’t need to adapt your campaign too much. As for Yahoo! Search, were you one of many that thought it went out with the Ark? I wouldn’t blame you for doing so, but it is another sign that some users simple don’t feel the need to change.
The remaining search engines are only going to be of interest to a very specific audience, but Ecosia deserves further mention. If you’ve never heard of the company, they are environmentally focused and claim to put 100% of their profits towards improving the planet. Their appeal may well grow, so perhaps it is a brand worth keeping an eye on.
Tineye is a reverse image search engine, and a very good one at that.
Use of online AI tools in the UK
I am surprised at some of the data in this section of the report. While I knew there would be gaps between age groups, it is apparent that the potential benefits of AI haven’t been fully grasped by older generations.
I’m going to qualify that statement – I actually belong in the 55-64 year old age group (only just!). To see that less than a quarter of my age group have used an AI tool shocked me. Perhaps I shouldn’t have been, but I was also astonished to read that only 41% of the entire UK online population had used AI.
A skewed perspective due to my occupation?
AI is clearly more important in my line of work than it will be for most. I am constantly asked about it, the implications on SEO, how (and if) it should be used and hundreds of other related questions.
That makes my perspective skewed and I’m at risk of falling prey to the trap of thinking that everyone else behaves as I do. However, you couldn’t have been online for the last 2 years and not come across ChatGPT, watched a programme that mentioned it or been even remotely intrigued by it, could you? Well, it seems I am wrong.
The fewer numbers of women using AI tools caught my attention too. In some age groups, the gap in that respect is huge. A massive 22% fewer 45-54 year old women use AI compared to men.
That said, we can expect this chart to change dramatically. I appreciate that 2 years is a relatively short period of time for something to ‘catch on’. New services, particularly in the field of technology, are always adopted by the younger generations first. Then, they make their way up the age groups. It was the same with the internet itself, and AI will be no different.
Most popular AI tools in the UK
Having been surprised by the first AI use chart, I wasn’t in the least bit surprised by this one.
ChatGPT has more than twice the popularity of its nearest rival, Microsoft Copilot. It should be noted that Copilot benefits in the same respect that Bing does. It is the default AI tool on Microsoft products.

Snapchat My AI is there by virtue of its younger Snapchat user base and well placed to grow. It is a tool that can answer a range of questions, offer buying advice and a lot more. It does most of what other AI tools do but is embedded within the Snapchat app.
Google Gemini is growing, although I’m in a camp that believes they made a mess of its AI launch. It launched as Google Bard and then became Google Gemini. It arrived far too late to the party in my opinion. However, Google Gemini Live is good (where you have a ‘normal’ conversation with your device).
If you’re looking at the chart and confused by “ChatGPT Plugin”, that is referencing a variety of additional tools you can add to ChatGPT. Plugins specialise in specific areas or subjects. I wrote a blog about these in relation to further education, learning and development using ChatGPT.
Reasons for not using AI tools
Having referenced my surprise at the lack of use of AI in the UK, this table goes a long way to explaining why it isn’t in the place I felt it would be.
If 38% of the online adult population isn’t interested in using AI, then I fully expect that to change. That is supported by the section showing that a third of people feel they don’t need to use AI. There is also 27% that don’t know how to use it.
You then get to the big one – a quarter of the online population don’t know what it is. This harks back to my comment about early adoption and the passage of time. It will make its way into the lifestyles of everyone and the daily use of it will become the norm. When that will be isn’t something I shall try to predict. Nonetheless, I feel that we’re on the cusp of change.

I understand the last two blocks on the graph, with users commenting on a lack of trust or concern with AI. The media coverage of AI in general has given understandable attention to the potential dangers, at least in respect of where it might lead the human race. I find most of those to be speculative at best and outlandish at worst, but time will tell.
Increasing education and overall visibility about what AI tools can do for the average user, beyond the now seemingly standard task of giving content ideas (or in many cases using AI to generate content entirely, which I’ve written more than enough about), is going to be essential to change users views.
Reasons for using AI tools
As already mentioned, finding information or content is the primary reason people in the UK use AI. The second most stated reason is to be expected – people are explorting the technology.
You can combine several of the other reasons to come back to the idea of using it for content generation. Whether it is summarising text or creating new text, we find ourselves sitting in the realm of content generation.

I won’t go into the other reasons on the chart, because I think the content generation aspect of AI is a dangerous one in terms of how users interpret the use of it.
Preaching that you shouldn’t use it to do homework, University papers or similar tasks isn’t my job. However, I think it is vital that users understand the importance of human creativity and unique content.
AI content generation and SEO
It has already been shown that AI generates AI-obvious content at times, although that is getting better. It doesn’t contain the spirit of the human mind or even a fraction of its creativity (and memories) at present. Because of that, there is a lack of personality in much of what it produces and that doesn’t translate well when someone is reading it.
Content related use will stay at or near the top of the graph for years to come, I’m sure of that, but high quality publishers will recognise the opportunity that gives for them to be different.
I am an advocate of AI use and there is a wealth of value to be had from it by businesses, be it for content ideas or ensuring you explore the depth of the language you write in. However, I feel like we’re in for a bumpy ride in the field of SEO until people fully understand how best to utilise the advantages it brings.
Most popular social media apps in UK
I read this chart with a degree of sadness. That’s not because I’m not a fan of social media. I think it delivers a huge amount of positives to the world, and at least sufficient to outweigh the negatives.
My sadness comes from seeing the plight of Pinterest. I was one of the first UK users of Pinterest and could see huge potential in it. It has enjoyed success in several areas, particularly weddings and interiors, but to see it now consigned to 9th in the chart and occupying fewer than 1 minute of UK adults time each day is unfortunate.

Yet, it grew in reach over the past year. I am not underestimating the task of reaching 13.2 million users in a month, but that is down on 2022 figures and I’m not sure where the future of Pinterest is. There was a time when Google and others toyed with acquiring the platform, but I see any future likelihood of acquisition by one of the internet giants to be low.
Rise of Reddit and SEO value
The same cannot be said of Reddit. As mentioned early in this article, growth of 47% year on year, from 14.9 million UK adults to 22.9 million per month, is something any brand should be taking notice of. Reddit isn’t the type of social channel on which you can blatantly push your brand, but it offers an immense amount of information in what are known as Sub-Reddits.
If you’re unfamiliar with Reddit, a single visit to it might remind some of you of old-style internet forums. Lots of people passing comment on various subjects. Reddit’s strength lies in the size of the global audience it has, and the quality of some of the Sub-Reddits. You can talk about SEO, digital marketing, your home town, your favourite car, home interiors, soft drinks or jokes until you fall asleep at your keyboard or smartphone.
The year-on-year increase in reach by TikTok is something I’ve already mentioned and should me on the list of any marketing department in respect of their social media strategy, but did you spot Quora’s growth?
Quora and backlink potential for SEO
Quora remains in private ownership and has avoided acquisition by one the giants of the internet – so far. Given the high Google ranking it achieves in almost every content area, it should be viewed as a way of exploiting visibility for most brands.
The ability to gain backlinks on the platform is obvious, although you need to approach your attempts to do so carefully. It is a more rigidly moderated platform than it was 5-6 years ago (when backlink placement on Quora was far easier).
Quora thrives on genuine advice. Offering advice and expertise is an excellent way of building your profile and backlinks, especially if you’re a service provider. It is off-page SEO that too many brands don’t explore, giving you an audience that sees you provide well intended (if it is!) advice and answers.
The chart demonstrates how much value UK adults place on Quora, and the 24% growth since 2023 is not to be passed by. I appreciate that an average time on the site of less than 1 minute doesn’t appear to be the ideal home for visibility. However, if you’re seeking backlink generation it represents another option for building links.
LinkedIn and audience engagement
That brings us nicely to another platform – LinkedIn. I don’t hesitate to say that I find LinkedIn a disappointing social media channel all too often. Since it was acquired by Microsoft, it has become increasingly packed with spam, often with people creating several accounts to put the same or regurgitated message out. The frustrating aspect of that is that the platform continues to give them visibility and masks far more creative and quality content that remains below the surface.
That said, you cannot ignore it if you’re prepared to publish good posts and do so regularly. The simple goal of keeping yourself seen is a valuable one to pursue. Following potential audiences and brands, actively participating in discussions, it all helps on LinkedIn.
Offering opinion, advice (similarly to Quoro), but to respected connections, is where the real opportunity is on LinkedIn. All of this comes with one major caveat – it happens to be that everyone else on the platform is trying to do the same. It has evolved into the classic “sell, sell, sell” portal on which far too many posts are little more than a sales pitch.
I’m not surprised to see that reach has fallen by 3% since 2023, or that the time people spend on the site is below 2 minutes. It supports a theory I have previously spoken of – people check it intermittently, looks for opportunities and leave it. Few users actually explore LinkedIn. That needs considering if you’re spending a lot of time curating content. It has to be good content and you’ve got to write it with your LinkedIn audience, not a more generic audience, in mind.
The addiction of YouTube
Finally, the universal appeal of YouTube and the SEO advantages it can deliver are clear when UK adults are spending 47 minutes a day on it.
If you have a social media channel on which you know you’ll reach 94% of the online adults in the UK, you’d be rushing off to ask why your business isn’t making more of the opportunity it presents, wouldn’t you?
YouTube viewing on TV in the UK
If you associate YouTube viewing with your laptop, desktop computer or on your smartphone, you’d be forgiven for forgetting the home TV set.
However, that would also indicate that you’re unfamiliar with the popularity of YouTube on TV. The chart below shows the astonishing growth of YouTube on television sets in the UK, by age groups, across the first halves of 2022, 2023 and 2024.

As you can see, the reach of YouTube for any brand targeting U17’s is nothing short of remarkable. Furthermore, YouTube TV viewing at all ages from 18 to 64 has been experiencing unprecedented growth.
The fact is that the UK online population now browse YouTube on smart TV sets and they consume huge amounts of content on it.
Indeed, whilst reach in the 65+ age group may be far lower, you can see the doubling of the reach between the first half of 2022 and the same period in 2024.
It has penetrated every type of viewing hardware and is often unnoticed on smartphones or desktops when a user finds a “How to” guide or a review, but it is now mainstream entertainment on the big home screen.
Time on social media apps by age group
When you’re looking to social media for targeting your audience, this chart shows the difference between the younger ages groups and their elders.
App use, in respect of time, drops as the age groups get older – in all but one case. Facebook & Messenger use grows from the 18-24 age group across the next 3 groups. Facebook remains the safe haven for the 35-64 age group in particular. This shouldn’t come as a surprise and there is a very interesting piece of data to bear in mind.
Facebook arrived in the UK in 2005 and caught on very quickly. If you are 40 years old today, then you were 19 years old back then. You were in the prime age group for it catching you – and many of those that were drawn to it have remained loyal.

That is one of the amusing things about social media. There is a strange tendency amongst brands to forget that platform audiences ages. It’ll happen with TikTok in exactly the same way. It is also the reason that Facebook hasn’t caught fire with the younger age groups. It is the home of their parents and relatives, it was already cemented in society, it wasn’t the cool place to be.
Younger age groups do tend to move, albeit in smaller time amounts, to Facebook eventually.
Use of social media apps in UK by gender
Yet another intriguing view inside the lives of the UK adult is provided with this chart. It shows social media use by app and gender, revealing differences in how we source our information and entertainment.
Pinterest has long been dominated by a female audience, for the sector reasons I mentioned earlier (weddings, interiors, etc). Social media app use by women is prevalent on Snapchat, Instagram, TikTok and Facebook.

YouTube use is close, but men show clear preferences on LinkedIn, Reddit, X/Twitter and Quora. The 70%-30% split (men v women) on Quora is the most obvious, but X has become an increasingly male preferred platform. That is partly due to the sport related content and male affinity to that area.
Whatever the reasons for the gender splits are, it is a useful graph that highlighting where attention should be if your audience is specific to one gender.
UK adult reach of X (Twitter) & Threads
The Ofcom report data on the ongoing X (Twitter) and Threads (Facebook’s rival) battle is entirely focused on July 2024.
There is no revelation in Threads being a long way behind X. However, Facebook continue to push the platform heavily and there are signs that it is making very specific in-roads to the formerly X audience.

Threads is generally seen as a less combative platform, and X has suffered an exodus of users in the UK (and globally) for the being the opposite. You should note that women are slightly ahead of men in their share of Threads use.
It doesn’t change Threads having fewer than a quarter of the daily UK adult visitors that X does, but I think this is a chart that could show a different perspective in 2025.
Twitter, X, Threads and SEO strategy
In respect of either platform’s opportunity to lend itself to your SEO strategy, they do present a visibility alternative or addition. Your opinion on their value will be entirely dependent on your target audience, product and service. I would add one note of caution – be aware of the potential for negative comments on X.
I was once a fan of X from a commercial use perspective (7-8 years ago). Using apps such as Tweetdeck gave a superb mechanism for gathering real-time user comments, collating it and targeting people directly (with messages). Nowadays, the value of that strategy has to be questioned, with the exception of reputation management.
That’s not to say that some services and products can’t get exceptional traction on it, but you need to be absolutely certain that your audience targeting and approach method is perfect.
UK adult use of messaging/call apps
WhatsApp is the clear leader of messaging and call apps. With double the usage time of UK adults and 87% reach, it occupies a position that others will find difficult to challenge.
The decline of Facebook Messenger, losing 3 million users in a year, doesn’t change the fact it holds a solid second place that I suspect will surprise many readers. The loyal audience I have referenced many times pays dividends for parent company Meta.

Google Messages has made impressive ground but remains a distant third, whilst the remaining apps are largely second-use or very specific to an audience.
WhatsApp Business is an important part of the overall WhatsApp offer. That’s where there are potential visibility and increased client contact gains, if not directly SEO related. However, there is a potent conversion rate formula to be realised when businesses adopt a more customer-focused online presence and incorporate WhatsApp Business as part of their offer.
UK adult use of dating apps
There has been considerable coverage of this next chart. The UK’s use of dating apps, generally, is in decline. There are some showing gains year-on-year, but they’re bucking the trend and their overall impact on the sector is small.

I’ve read and watched several of the conversations on this subject. The general consensus appears to be that UK adults are becoming somewhat bored of dating apps.
I can’t speak from a position on authority on their use (which my wife will be pleased to read), but I’ve worked closely with a dating brand in the past. Their focus was on more personalised introductions, through a website, but times have changed and the owners of brands such as Tinder have commented that they are constantly looking a new ways of engaging their user base.
When you see one or two brands decline in use, there can be brand-specific reasons. However, this is a very noticeable drop across the majority of dating apps. I listened with interest when I heard some commentators say that the “looks first” method of dating and lack or prolonged engagement online was becoming a factor in the UK.
That said, I don’t like to write too much about apps I have little or no direct experience of, so I’m going to bow out on this area and say that you’ll have to make your own mind up based on the data.
I’ll leave you with one highlight comment from Ofcom – 2 million UK adults used a dating app on Valentines Day in 2024.
Share of time on porn sites in the UK
If you raised an eyebrow upon seeing that Ofcom reported on porn site use by UK adults, it is proof how thorough their examination of behaviour is.
Porn sites occupy a large amount of UK adult time. The share of that time across the most visited sites is shown below, split out by device type. I’m not sure why, but the amount of time spent browsing porn on a smartphone stunned me.
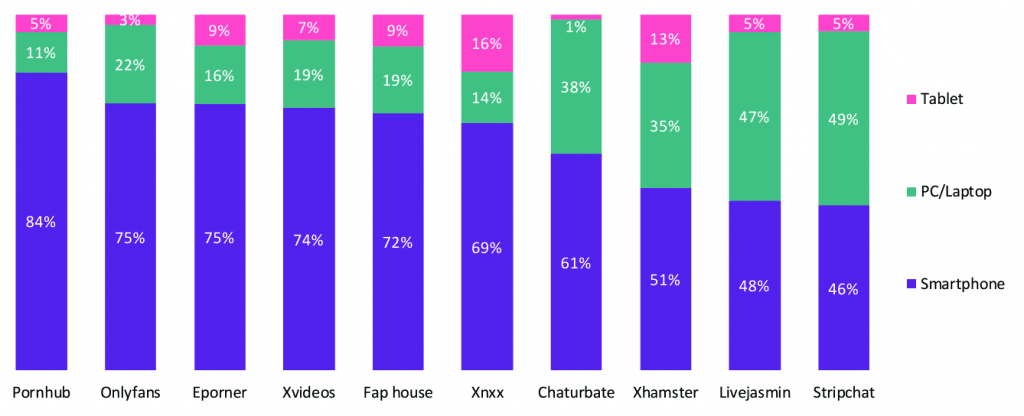
Pornhub leads the way, as it does globally, and the prominence of Onlyfans is obvious. However, Onlyfans shares UK adult time very closely with another 3-4 sites. Beyond that come several chat related porn sites.
If you market adult/porn related services or products, the data is valuable in respect of identifying the placement of PPC advertising campaigns. The device split is also high value, because it often dictates the type of advert you might opt for.
Remaining with advertising use to close this section, I spotted Ofcom reported that UK use of Pornhub had dropped down their table of country visitors. The UK was second place after the USA, but is now 5th.
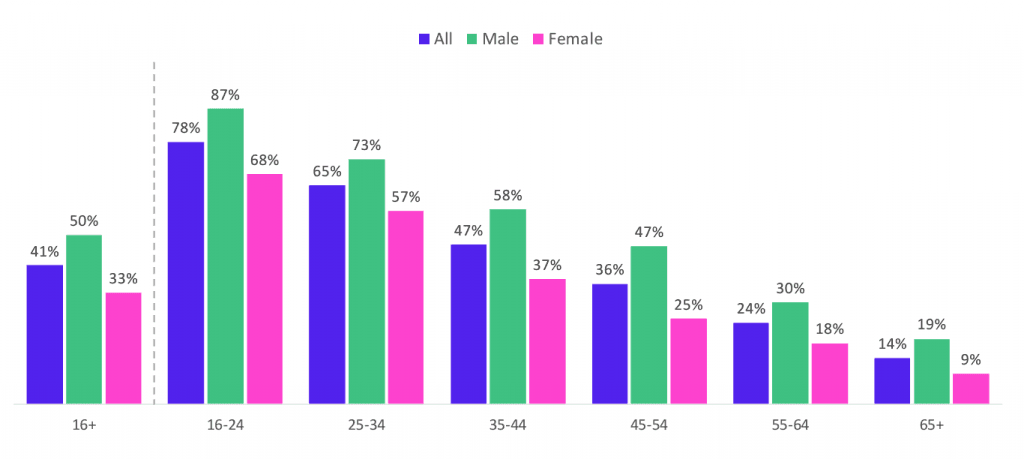
UK adult reach of porn sites by gender
The top 10 porn site visits have a majority male audience. The gender split reveals that only 3 of those sites achieve more than 20% reach to females in the UK.
However, the volume of females visiting Pornhub is not too far off being a third of all their UK reach. The areas in which there is almost total male dominance are the chat and strip related services.

Again, this is incredibly value data for marketing executives when identifying audience reach.
On a more generic note, 29% of UK online adults visited a porn site in May 2024. It’s a fact of life that porn attracts huge volumes of adult interest and isn’t a subject to be ignored or washed over when examining online behaviour.
As a society, the UK is often seen as a “behind closed doors” or less open culture when it comes to sex, but that is a stereotype firmly belonging in the past as the data makes loud and clear.
Most popular news websites in the UK
Topping the most popular news websites is the BBC. The UK’s public service broadcaster has long been the most trusted source of news and it strengthened it’s position at No.1 after a dip in 2023.
It is followed by 3 of the UK “red top” tabloids, The Sun, Mail Online and Daily Mirror. Ofcom’s analysis of new source reach by home nation shows a similar picture to that across the UK as a whole.

The penetration of Apple News is a result of the reach provided by Apple smartphone and tablet devices. There is little evidence of any rising threat to these mainstream providers of news, although Sky News is the only platform to have seen two consecutive years of growth.
Time spent on news websites in UK by gender
News website data becomes interesting when you look at the differences in the time spent on sites by gender.
There is a marked longer period of time spent on the BBC site by men, with the only sites on which women spend longer being Mail Online and Apple News.
However, you’ll immediately spot how low the time spent on sites where the tabloid and other printed newspaper brands are concerned (with the exception of the Mail Online and Telegraph).

I’m unsure as to why men spend considerably longer on the BBC site, although if I was to take a punt I would suggest it to be sports related interest.
Ofcom offer no answer to this disparity. Indeed, the only real connection they provide to any gender time differences is that females probably spend more time on Apple News due to their higher ownership of Apple devices in the UK.
UK adult access to healthcare sites and apps
The use of health related apps and sites, split by age group, provides a reminder of the influence of socio-economic groups.
By far the lowest group in terms of access is DE, the lowest in the UK. The group is classified as “Semi-skilled & unskilled manual occupations, Unemployed and lowest grade occupations” and accounts for approximately a quarter of the UK population.

The data is of interest to anyone in the healthcare sector, particularly when developing and SEO strategy that might be age related in terms of their target audience.
I found the AB social-economic group access to be fascinating, showing that 82% of UK online adults belong to it use healthcare sites and apps. I use the NHS app myself out of sheer convenience, but didn’t anticipate the overall access to such apps and sites would be as obviously connected to socio-economic groups as it is.
How many people play online games in UK?
If there was any part of the Online Nation report that needed a more detailed breakdown of age groups, it was this one.
Younger users dominate the gaming sector in the UK, but there are interesting trends within the data. For example, across all age groups, gaming use has dropped for the third consecutive year – from 39% in 2021 to 35% in 2023.

However, gaming grew in all Under 15 age groups (4 in total) with the exception of the 8-11 year olds, where it too has seen a third consecutive year of decline. There is no obvious reason for this.
The growth in younger people gaming is significant. The 3-4 year old group now sees almost a quarter of children involved in online gaming. I’m reasonably sure much of that will be educational games – or is that more hope than reasoned argument?
Average time spent playing games online in UK by age and gender
Before you read this, I need to stress that the times shown on top of the Ofcom bars in each age group are Hours Per Week.
Across all age groups, males spend more time gaming than females, but the gap is far less in the over 45’s.

There is a very easy way to summarise the data. Across all ages, from 16 to 64, the average online user in the UK spends an hour a day gaming. That is a lot of time when you think about it, but by far the most active age group are the 25-34 year olds. That took me by surprise, as I would have happily predicted the U18’s would have easily topped the chart.
However, this is where smartphone games come into play (pun intended), and their popularity with UK adults is ever present.
Most popular mobile games in UK
UK women show a complete whitewash over men when it comes to mobile gaming in the UK. On every one of the top 10 mobile games, they are the major players – and in some cases their gaming preferences scream out.
For example, women make up 70% of all Candy Crush Saga players, and a whopping 77% of Solitaire Grand Harvest players.

However, 6 of the top 10 games have seen a decline in use between May 2023 and May 2024. There are 3 new entries disrupting the chart. Monopoly GO! has attracted an incredible 1.7 million players, with Dominoes Class Edition and Crossword Puzzle Redstone behind it on 1.2 million and 0.9 million respectively.
If your target audience is predominantly or completely female, the marketing campaign benefits of mobile ads becomes clear.
Many of these games require players to watch advertisements between levels or stages in order to progress or get credits/points. That gives you a captive audience waiting for your ad to finish and watching the screen throughout to click the small cross or similar icon that appears when it ends.
Most popular shopping websites in UK
Amazon remains the premier UK shopping portal with a very small growth in user in the last 12 months.
eBay holds a relatively secure second place but it is the rise of Temu in 4th place that is the headline of this chart. It has gained a mammoth 6.3 million visitors from the UK in the last 12 months, allowing it to reach 42% of the online adult population.
This puts it within 1% of Apple, a remarkable achievement and testament to the number of people seeking low-priced bargains as the cost of living crisis continued in the year.

All of the remaining shopping sites also experienced growth, and the list constitutes an unsurprising brand table.
Ofcom mentioned several brands that didn’t make the top 10 but merit watching in respect of where the nation is heading. AliExpress grew by 47%, taking it up to 17th in the chart, whilst low priced clothing brand Shein occupied 14th place and now reaches 22% of online adults in the UK.
Fastest growing retail websites in UK
The rapid rise of Temu, Shein and AliExpress prompted Ofcom to include a chart showing their progress in the UK.
Temu has witnessed UK penetration that most brands can only dream of, although the graph shows it hasn’t been without a major stutter in the first quarter of 2024.

There is even a comment by Ofcom that says “UK users may be attracted to the competitive pricing offered by these Chinese retailers as households navigate the cost-of-living crisis” – and I doubt anyone is going to disagree with that.
Most popular online marketplaces in UK
Despite being the only top 10 retail site above to have a seen a decline in UK reach, eBay still tops the marketplace chart.
Facebook Marketplace has proved to be very popular in the UK, with 14% of UK online adults saying they’ve posted items for sale on it. That is the same figure as eBay, a statistic that I found to be supportive of just how in-tune with their audience Meta companies are. Facebook Marketplace arrived at a time when the platform was facing new challenges, and it has delivered user retention in spades.

Etsy, widely known as the craft marketplace, remains popular when it comes to buying items with Vinted next in the table and Depop making up the top 5.
Beware of the taxman
There could be a fly in the ointment of all these marketplaces in the near future. HMRC announced that it would be tracking sales and gave ‘ceilings’ in terms of monetary sales where tax would become payable.
The HMRC rules go a step further than I suspect many users realise. As of 1st January 2024, they legally require all marketplaces to report sales above the thresholds they give. In other words, if you’re selling on these platforms on a regular basis, your data is being provided to HMRC and you could receive a letter in the form of a tax demand.
The impact of that is yet to be seen, as the Ofcom data runs up to May 2024, but I won’t be at all surprised to see some change from a sellers perspective – at least those that think they don’t need to consider tax.
Does the UK think the internet is safe?
There is a reasonably strong majority that think the internet benefits outweigh the risk in the UK. Averaging 67% across all adult age groups, the general opinion is clear.
However, this table shows how different age groups may have had varying experiences that influence their opinion. The obvious stand-out statistic is that only 59% of 18-24 year olds consider the internet safe. That makes them the only age group Under 64 years of ages to have that opinion, and the least likely to have that view out of all UK adults.

The other stand-out is that Bisexual, Gay or Lesbian adults have a more favourable view on internet safety than Heterosexual adults, and by a significant margin.
I think the chart shows an increased level of education on the internet in the UK, the risks it poses and the steps you can take to protect yourself. Users are possibly more aware of scams and threats, although the complexity of these is increasing.
Do UK users think the internet is good for society?
Opposing the view on internet safety is a very different opinion on whether or not the internet is good for society.
Across all age groups, only 40% consider it is good. The more prevalent view was a neutral one, at 45%. That said, only 15% of UK adults think the internet is damaging society.
One area in which there is parity with the opinion on internet safety is that the younger age group of 18-24 has the highest percentage of user that believe it to be damaging – and they were also the most likely to say the internet risks outweighed the benefits.

I have long thought this is one of the most controversial of subjects. You could argue forever about all the negatives that the internet has brought, and you would receive a counter argument for each. The same would be said for all the positives.
Generally, I think this table demonstrates that UK adults are well aware of the impact the internet has had on society, and each time they think of a positive they are reminded of a negative. They know it is a finely balanced tool of modern society.
UK users biggest internet concerns
Ofcom reported on what UK users worry about most in respect of the way the internet is used. Their findings aren’t surprising, at least where adults are concerned, but I think the concerns of children are the least known and demand greater focus.

Children are frequently exposed to content promoting suicide online. You’ll have seen it in the news, and probably seen interviews with grieving parents for whom your heart breaks. It remains of major concern in the UK and needs addressing. I don’t have the answers, I wish I did.
Bullying and self-harm are equally of concern, and all of the content listed by children highlights why younger age groups have a greater level of distrust or concern about the safety of the internet. Adults are far less exposed to this type of content and far bette equipped to deal with it if they are.
The positives to take from the table are that concern appears to be dropping on most elements, but it needs to continue in that direction with real action to eliminate as much of the offensive or damaging content as possible.
How many UK users have seen deepfake content?
It is credit to Ofcom that they surveyed the use of deep-fake content and exposure to it. For clarity, deep-fake is the use of AI-generated video that mimics a real person to spread malicious or false content. I could give a far more detailed description of deep-fake, but I think you’ll know the type of content we’re talking about.
I found the percentage of men that have seen deep-fake to be intriguing when compared to women. Over 50% of men claim to have seen deep-fake content, where only 35% of women said they had.

This male statistic goes across all age groups and is hugely different in the 45-54 year old group. I’ve sat and thought about this for a while and then noticed something else within the Ofcom commentary.
It said that only 9% of UK adult internet users felt confident that they could identify deep-fakes. My thought process had been heading in this direction. Could it be that fewer females had identified content as deep-fake? However, when there is no reason to suggest they should be less adept at doing so, is it their browsing habits that make them less exposed to it? If you go back to the section on porn content and the male dominance in respect of viewing it, you can easily see why men might be more exposed to deep-fake – because porn is known for the use of it. I’d love to hear of any different opinions on this.
Summary & Feedback
You can read the full Ofcom Online Nation report by downloading it.
I find data of this depth to be fascinating, intriguing and of immense value. It tells you so much about UK online behaviour, to such a degree of detail, that you cannot ignore it.
I’m not going to comment further on it because of the amount of opinion I have given on each section, but I’d love to hear your thoughts on the data and what it says about the direction in which the UK is moving.

Leave a Reply